Most teams adopt SLOs backwards. They pick a number that looks reassuring, 99.9%, because it sounds serious, and back into whatever metric makes that number true. That's not an SLO. It's a vanity metric with a fancier name, and it doesn't survive contact with the first incident review where someone asks what 99.9% actually means for a real user.
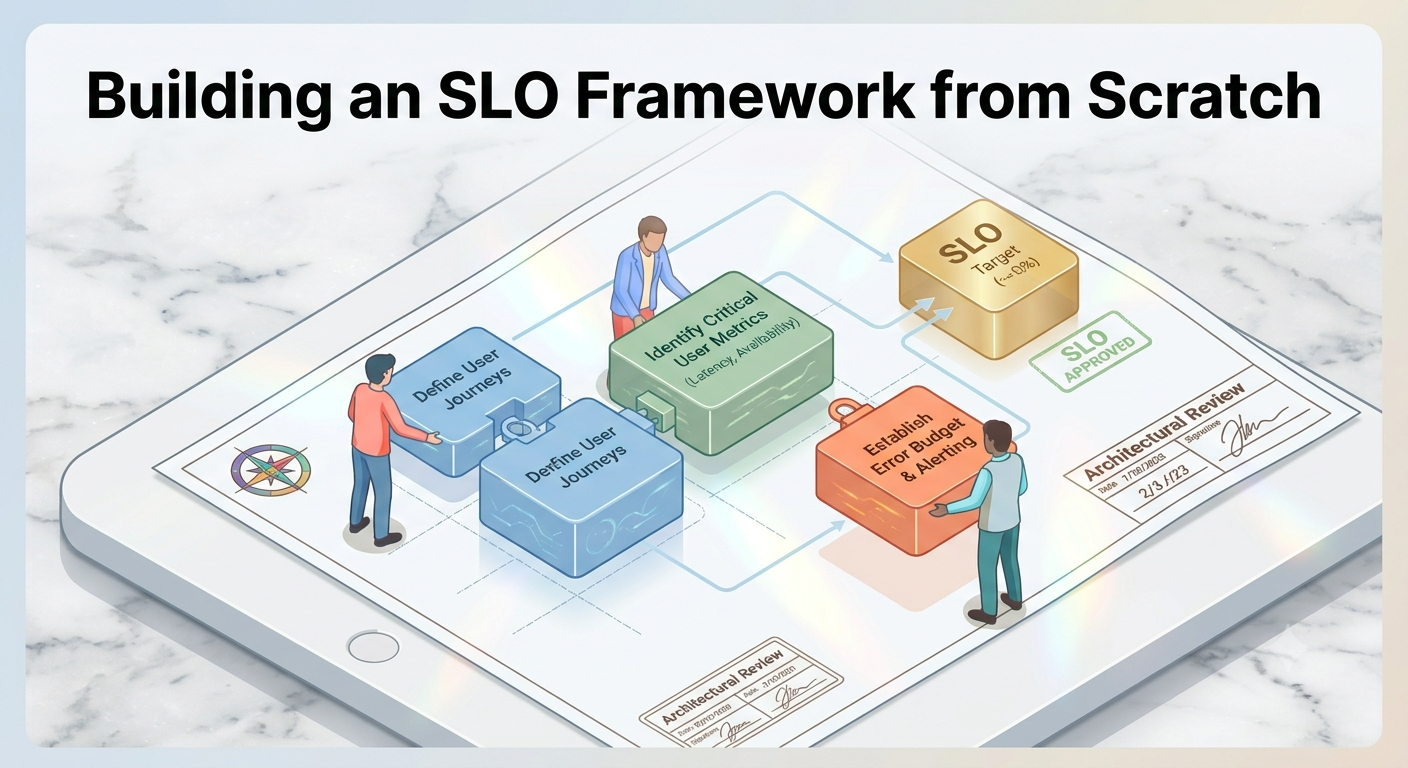
A useful SLO starts with the user journey, not the infrastructure. This is a practical starting point for building one, and the reframing that makes error budgets worth the effort of tracking them.
Key takeaways
- Start from the user journey, not the metric: what does "working" mean to someone trying to complete a task, not to a dashboard.
- Google's SRE guidance is explicit that a first attempt doesn't need to be perfect: "Your first attempt at an SLI and SLO doesn't have to be correct; the most important goal is to get something in place and measured."
- The error budget, not the SLO number itself, is the actual point. It converts reliability from an aspiration into a quantified resource that constrains and informs prioritization.
- Practical starting point: one critical journey, a two-metric SLO (latency + availability), a 30-day rolling window, reviewed weekly for a quarter before automating anything.
Why the vanity-metric pattern happens
"99.9%" gets picked first because it's a number leadership recognizes and can put in a slide deck. The metric gets reverse-engineered afterward, usually landing on whatever's easiest to measure: infrastructure uptime, a health-check endpoint, a metric that's already flowing into a dashboard somewhere. None of those necessarily correspond to whether a real user's request actually succeeded.
Google's own SRE guidance pushes in the opposite direction on purpose. Rather than insisting on a perfect target from day one, the guidance is to get moving: "Your first attempt at an SLI and SLO doesn't have to be correct; the most important goal is to get something in place and measured" (Google SRE Workbook, "Implementing SLOs"). That's permission to start with an imperfect but user-facing metric over a perfect but meaningless infrastructure one.
It's also worth naming the other end of the failure mode: teams that chase 100% reliability. Google's guidance is direct about why that's a mistake too, not just impractical, actively counterproductive, since a service with no acceptable failure rate can never ship a change that carries any risk at all.
Start from the user journey
The question to ask isn't "what can we measure," it's "what does working mean from the perspective of someone trying to complete a task." For an API, that's usually a latency threshold paired with a success-rate threshold, and critically, measured at the edge, at the point closest to the actual caller, not inside a single internal service three hops downstream from where the user's request entered the system.
Measuring inside a single service tells you that service is healthy. It doesn't tell you the user's request succeeded, because the request might have failed at a gateway, a load balancer, or a downstream dependency the service doesn't know about. The edge measurement is the one that maps to what the user actually experienced.
The error budget is the actual point
Once a team has a number that represents acceptable failure, tied to that user journey, they stop treating every incident as an emergency and start treating budget burn as a signal. A 99.9% target yields roughly 43 minutes of acceptable downtime per 30-day window; once you frame it that way, a five-minute blip is a rounding error against the budget, not a fire drill.
That reframing does more for deploy velocity than any CI/CD tooling change. Google's guidance describes error budgets as the mechanism that links reliability directly to release decisions: when the budget is exhausted, the team can justify slowing down releases or freezing risky changes; when the team is comfortably within budget, that's the signal to ship faster, not a coincidence unrelated to reliability work. The budget is what makes "should we ship this risky change today" a data question instead of a gut-feel argument between whoever's loudest in the incident channel.
Practical starting point
Skip the temptation to instrument everything at once. A workable first pass:
- Pick one critical user journey. Not every endpoint, not the whole system: the single flow that matters most if it breaks (checkout, login, the core API call your product depends on).
- Define a two-metric SLO. Latency (a percentile threshold, like p95 under some number of milliseconds) and availability (successful requests over total requests), both measured at the edge.
- Give it a 30-day rolling window. Long enough to smooth out single-day noise, short enough that a bad week doesn't take a full quarter to age out of the budget calculation.
- Review burn rate weekly for the first quarter. Before wiring up automated alerts or freeze policies, watch the number by hand long enough to understand its normal range and what a real incident does to it. Automating against a target you don't yet trust just produces noisy pages.
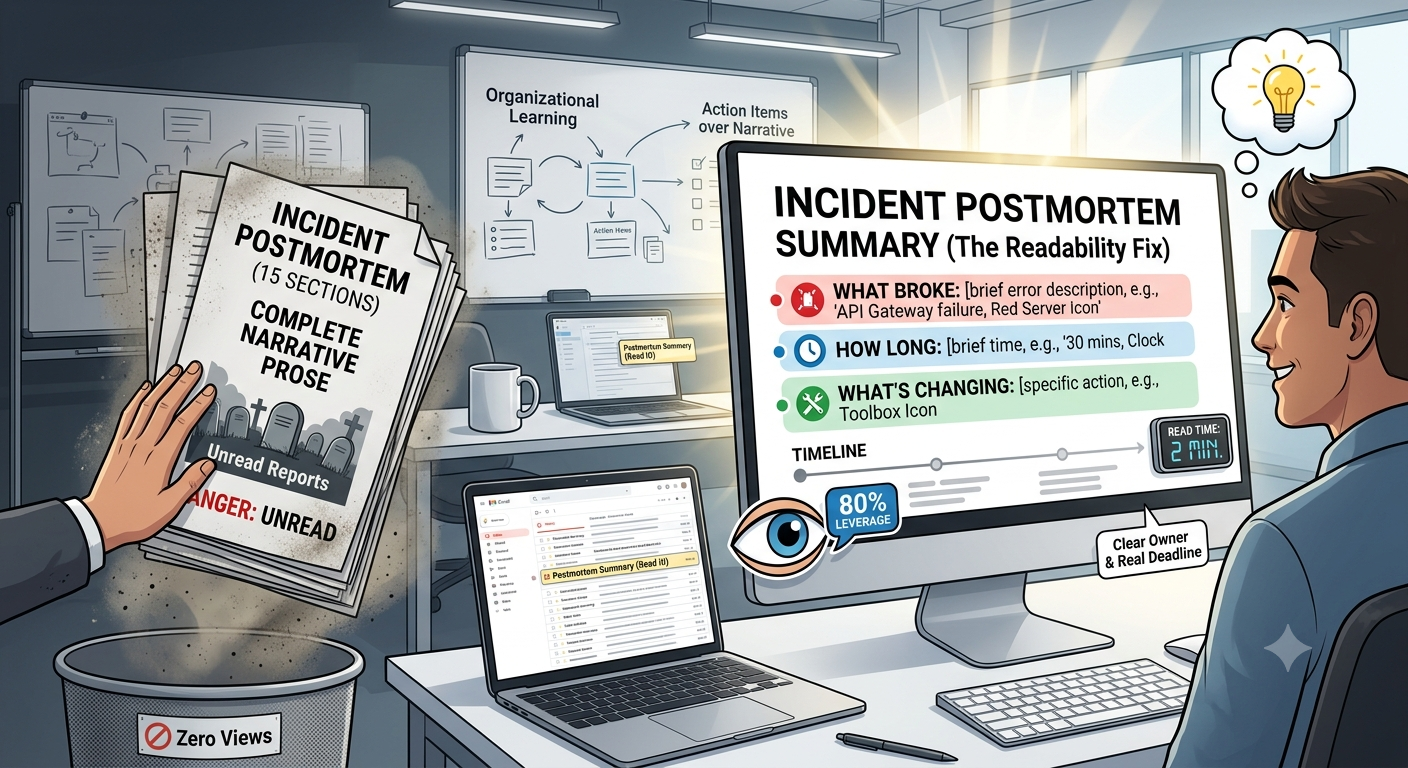
Once that first SLO has survived a quarter of real incidents and near-misses, expanding to a second journey, or connecting burn rate to an actual freeze policy, is a much smaller step. This is also the natural moment to fold in a lighter-weight practice like postmortems that people actually read, since a strong postmortem process is what turns budget-burning incidents into fixes instead of just repeated line items.
Frequently asked questions
What if we don't have edge-level telemetry yet? Start with whatever's closest to the edge you actually have, a load balancer or API gateway metric is usually good enough for a first pass, and treat getting closer to the true edge as an improvement to make once the SLO habit is established, not a blocker to starting.
Should every team have its own SLOs? Only teams that own a user-facing journey need one immediately. Internal platform teams can start with an SLO for the service they provide to other engineering teams (build pipeline availability, internal API latency) using the same framework.
How is this different from just tracking uptime? Uptime describes the infrastructure's state. An SLO built around a real user journey and paired with an error budget describes the user's experience and gives you a number that directly informs whether to ship or slow down, which plain uptime tracking doesn't do on its own.
Need infrastructure work like this done right? See what I do or look at recent builds.